Q Bio
Q Bio Health Dashboard · Longitudinal · multimodal · physician-reviewed

Your health, organized into a living clinical record.

The Q Bio Health Dashboard integrates imaging, biomarkers, genetics, medical history, and physician-reviewed insights into a single interface — designed for clinical interpretation and long-term tracking.

The Dashboard is delivered with every Q Exam — at our Redwood City clinic and through partner deployments.

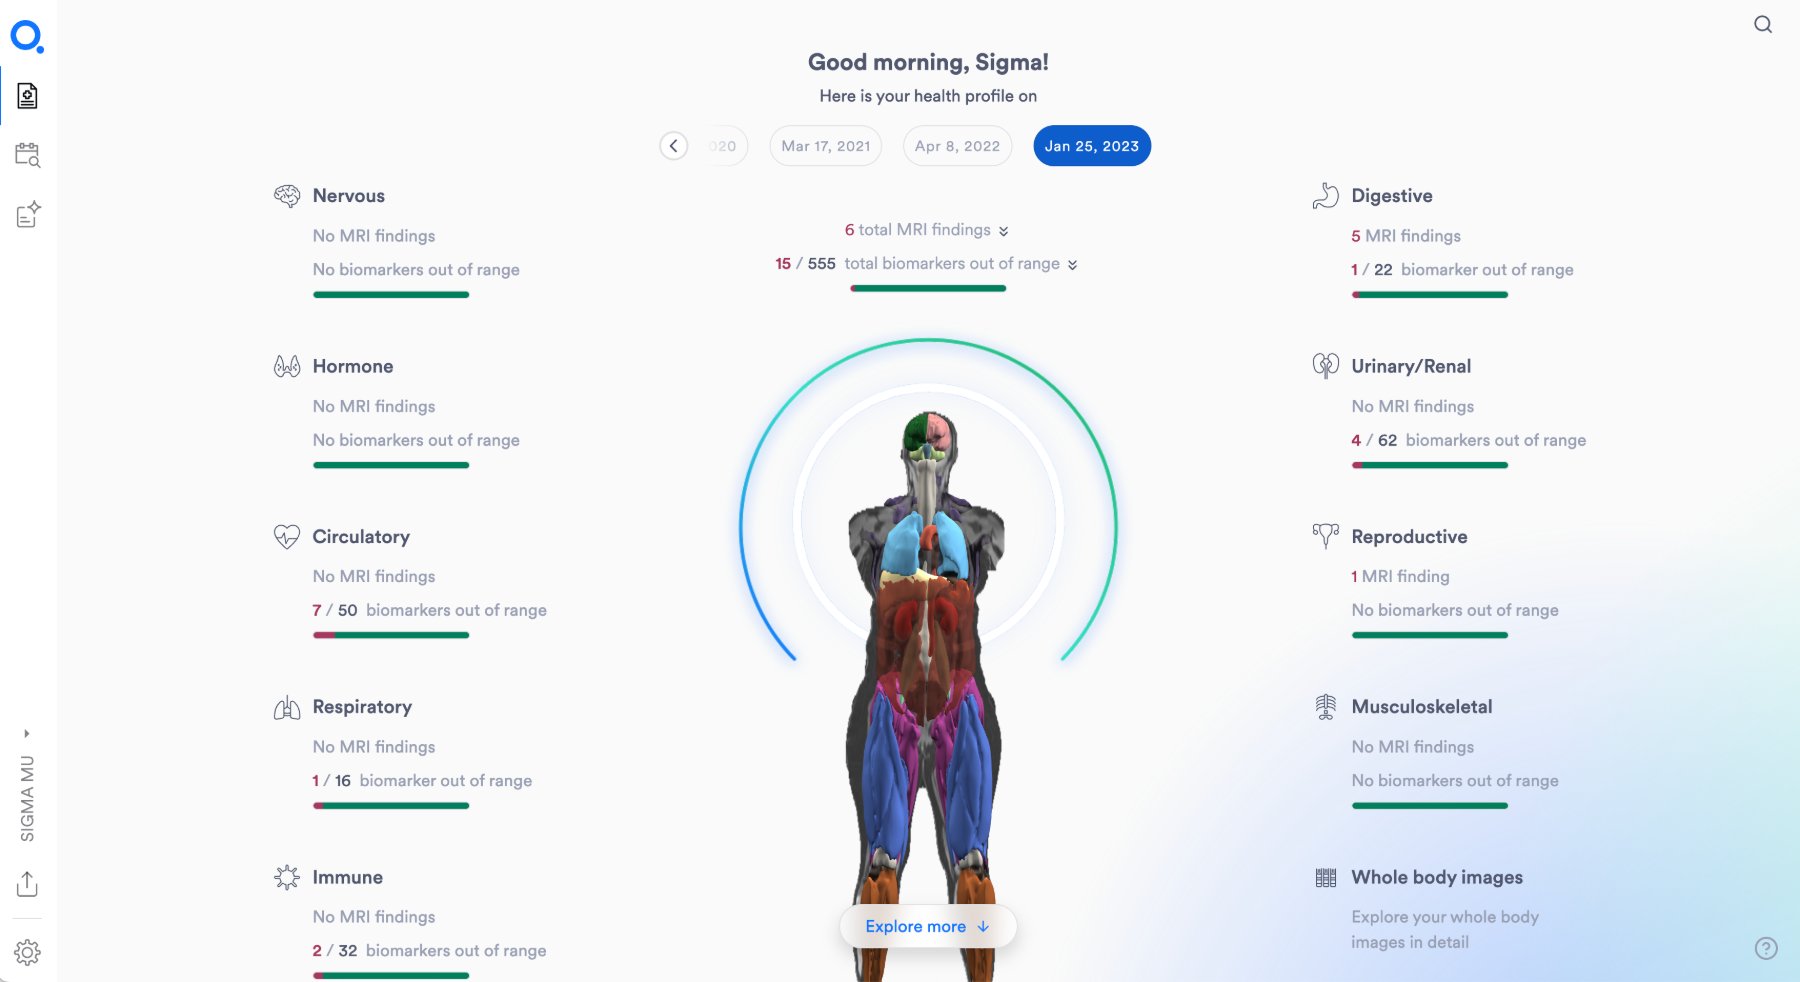
Q Bio Health Dashboard patient overview: ten body systems with MRI findings and biomarkers out of range, anchored by a 3D body and a date selector across multiple exams.
01 · Tabs by system

Switch between systems

Move across Circulatory, Respiratory, Immune, Digestive, and the rest from a single tab bar.

02 · MRI viewer

Images in context

Major body systems show imaging findings and relevant out-of-range biomarkers at a glance.

03 · Biomarker grid

Ranges, history, flags

Each biomarker carries its history, expected range, and a flag when it falls outside it.

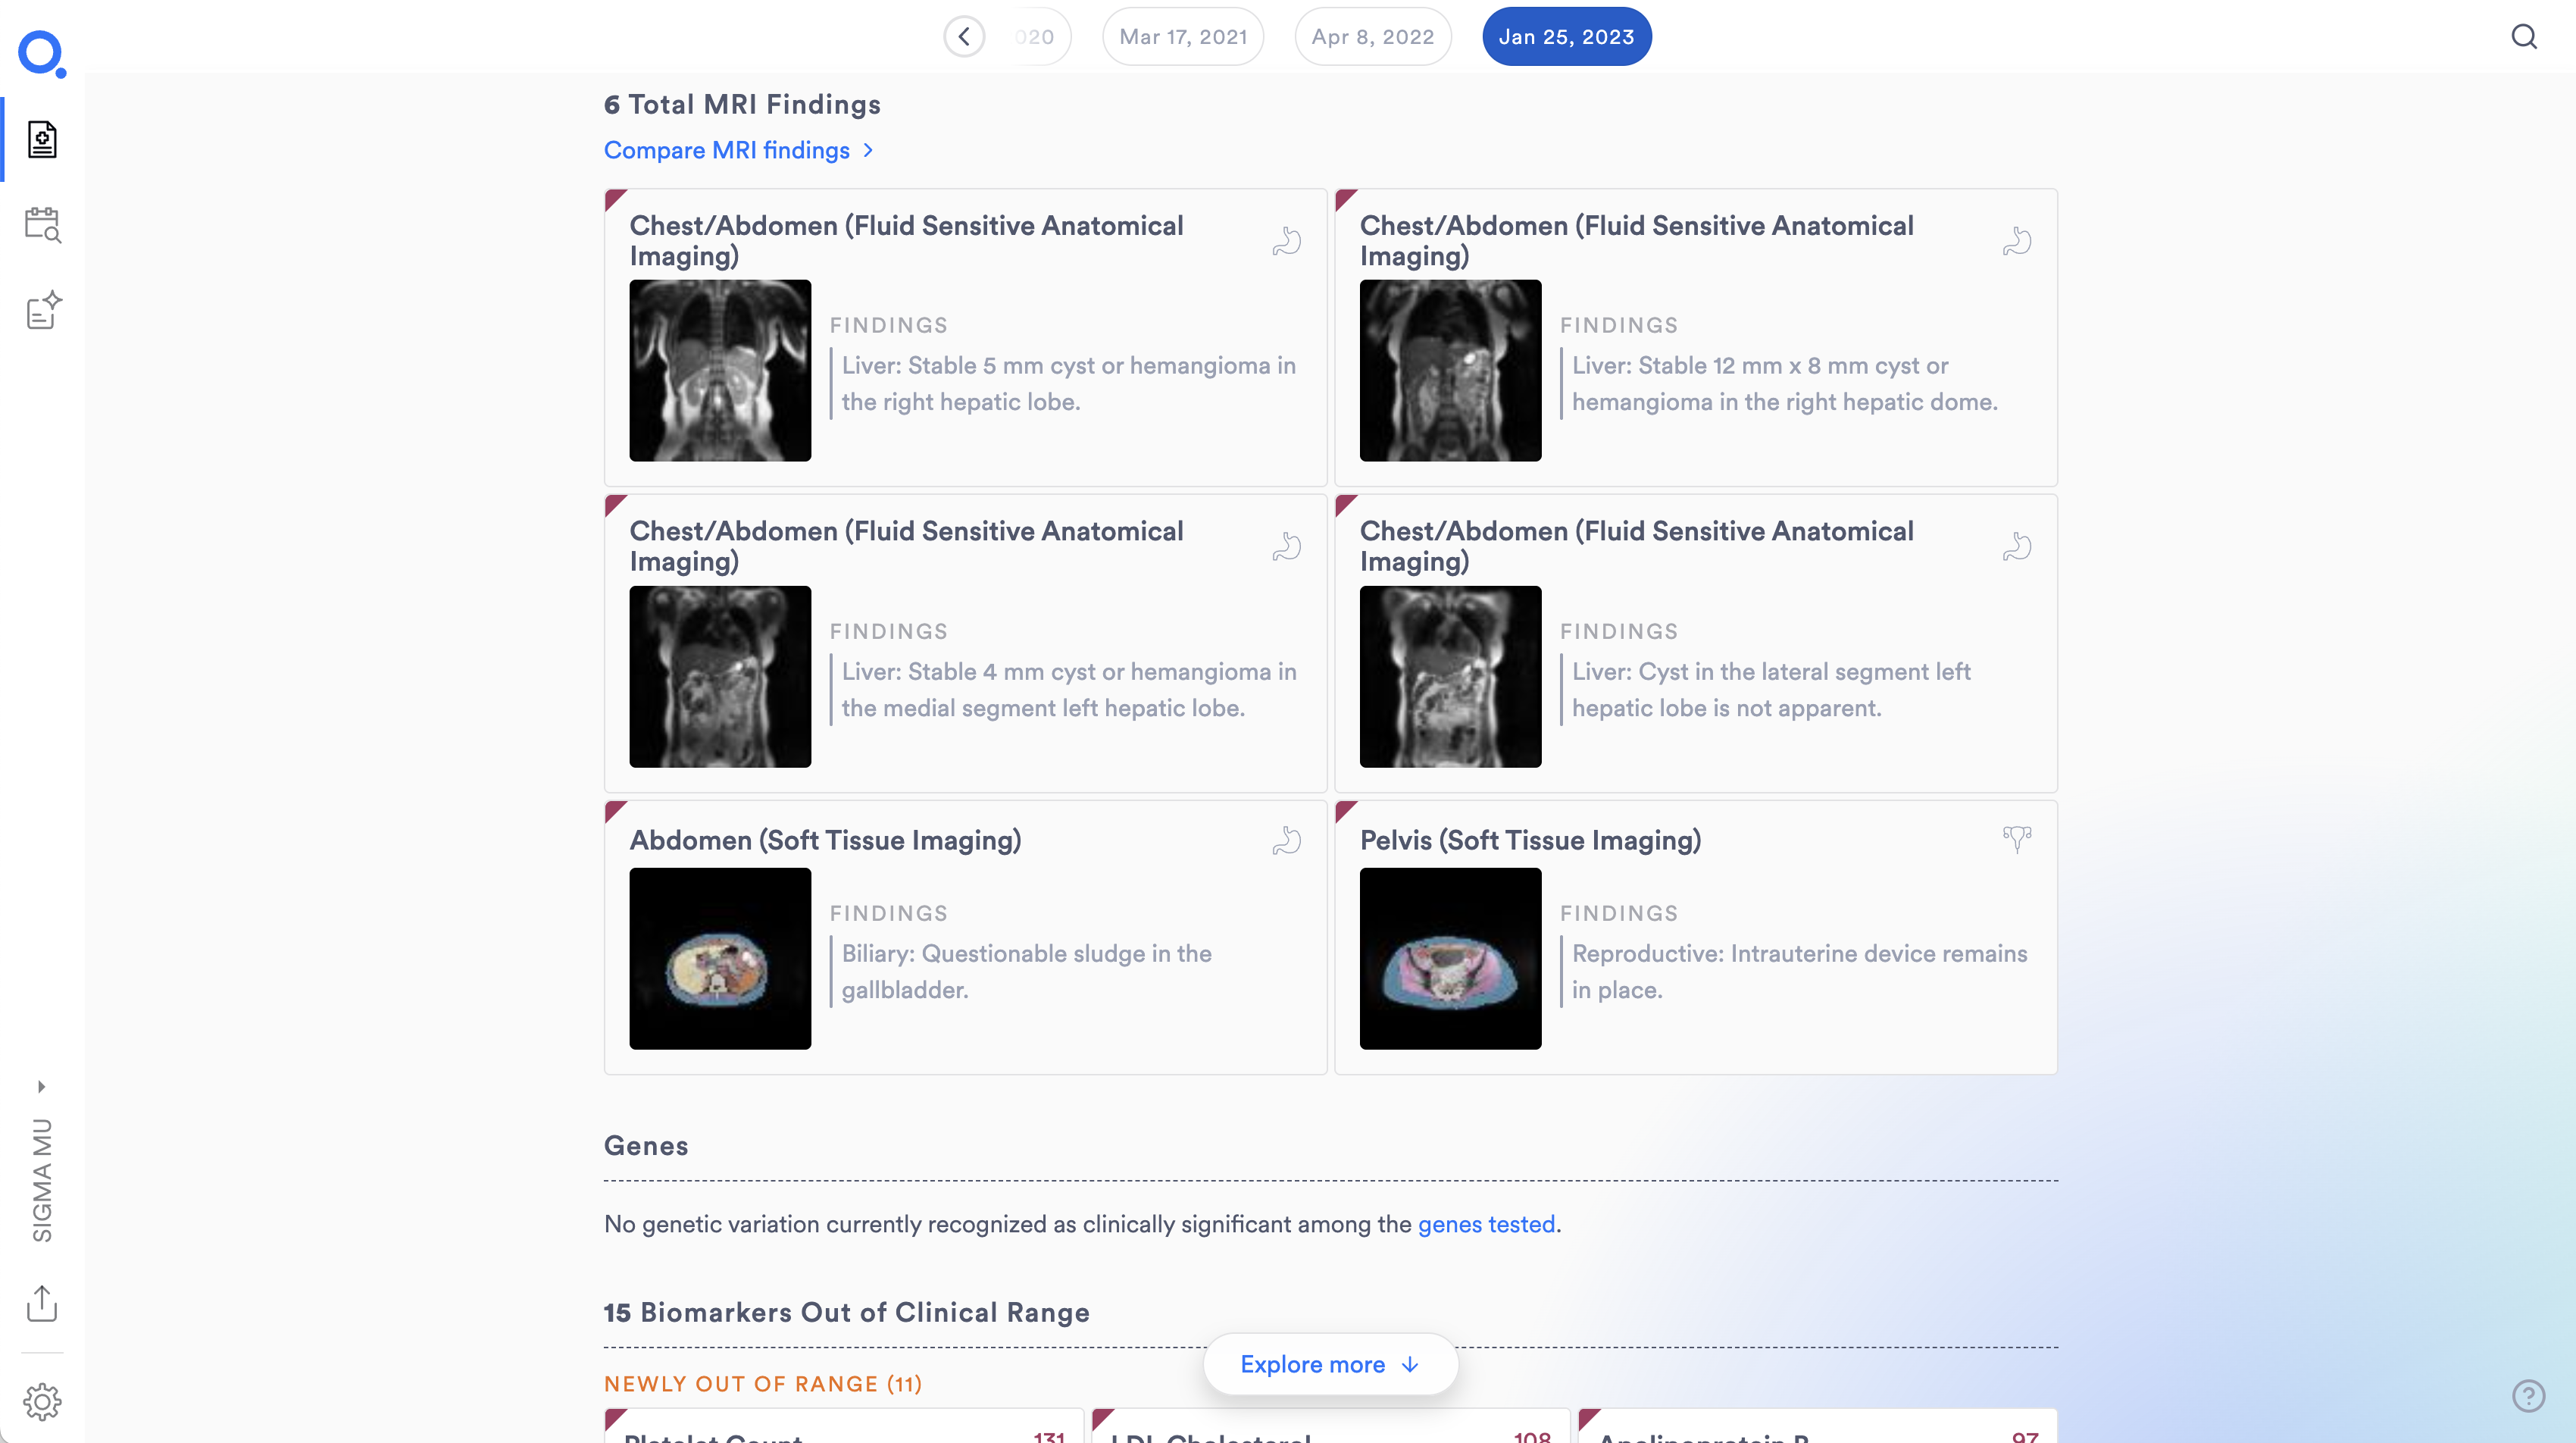
Patient view · MRI findings · Jan 25, 2023 Six MRI finding cards from the Q Bio Health Dashboard — Chest/Abdomen fluid sensitive anatomical imaging panels showing stable liver cysts and hemangiomas, plus abdomen and pelvis soft tissue findings — with a date selector across exam history and a Genes / Biomarkers section beneath.
Imaging findings

Every MRI finding, with the image attached

Each finding is paired with the imaging slice it came from, organized chest → abdomen → pelvis, with a date selector to move across exams.

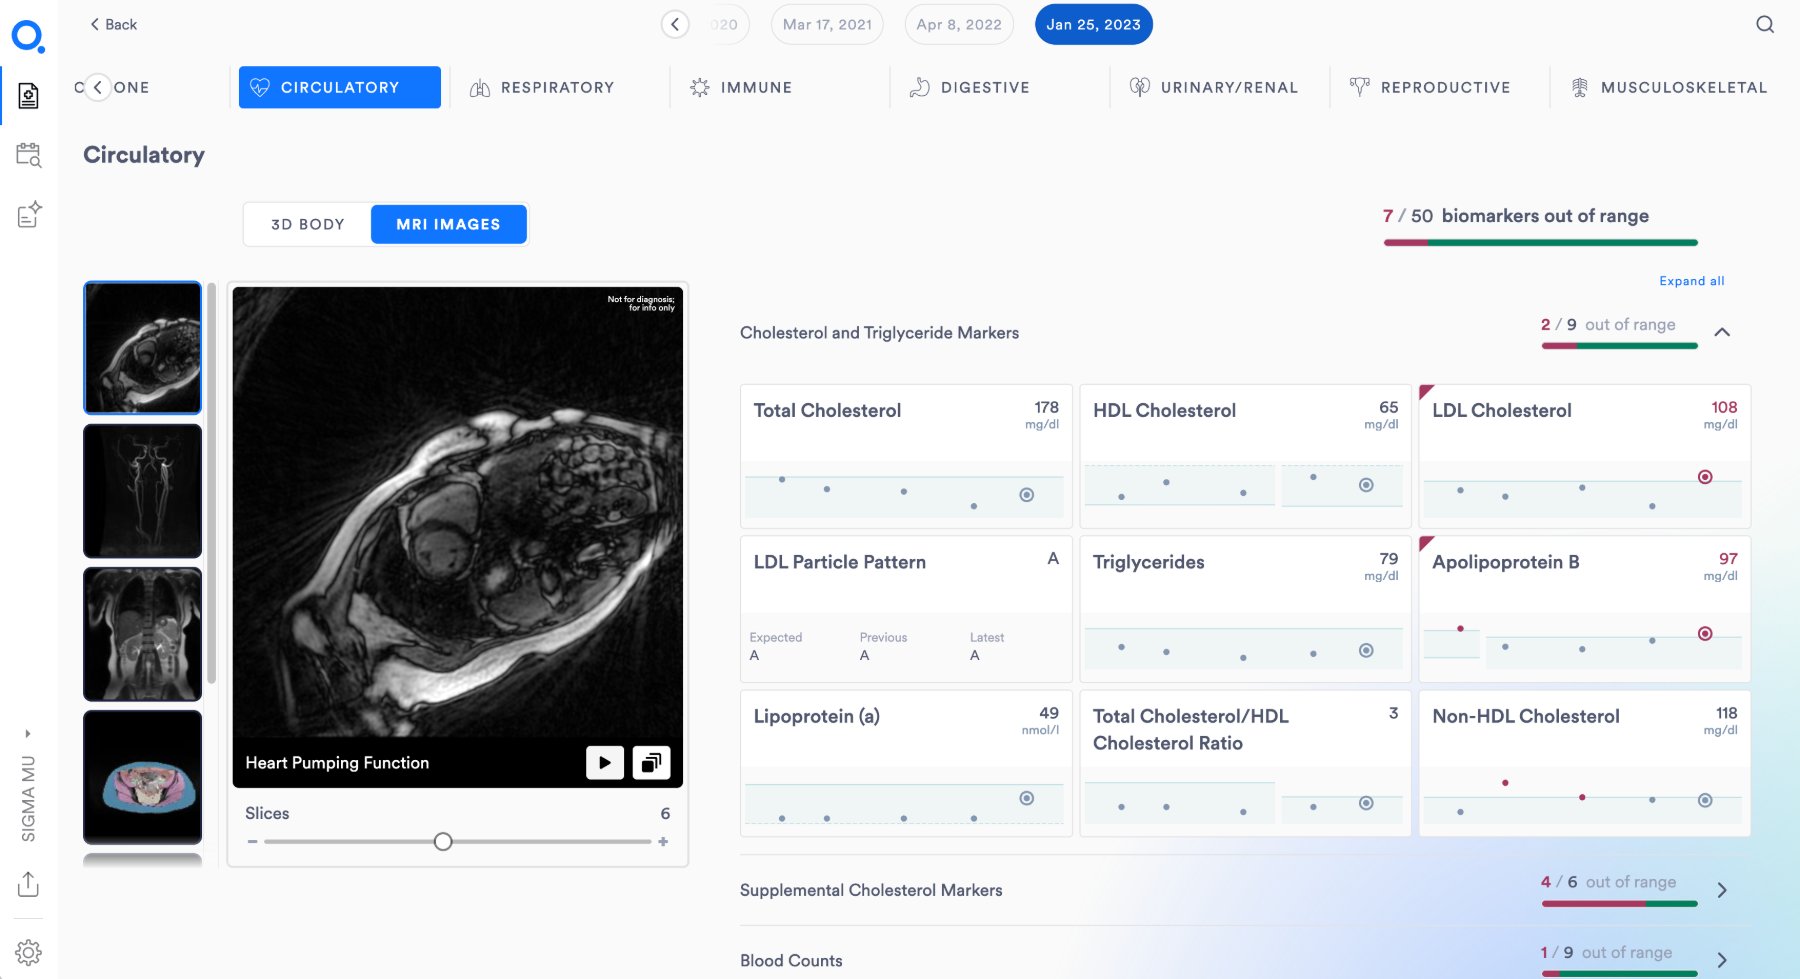
Clinical view · Circulatory Circulatory system detail: MRI image on the left, biomarker grid on the right with cards for Total Cholesterol, HDL, LDL, Triglycerides and others, with out-of-range markers flagged in red.
Circulatory drill-down

MRI imagery beside the biomarker panel

The clinical view places the MRI slice next to the panel of cardiovascular biomarkers — Total Cholesterol, HDL, LDL, Triglycerides and others — with out-of-range values flagged in red.

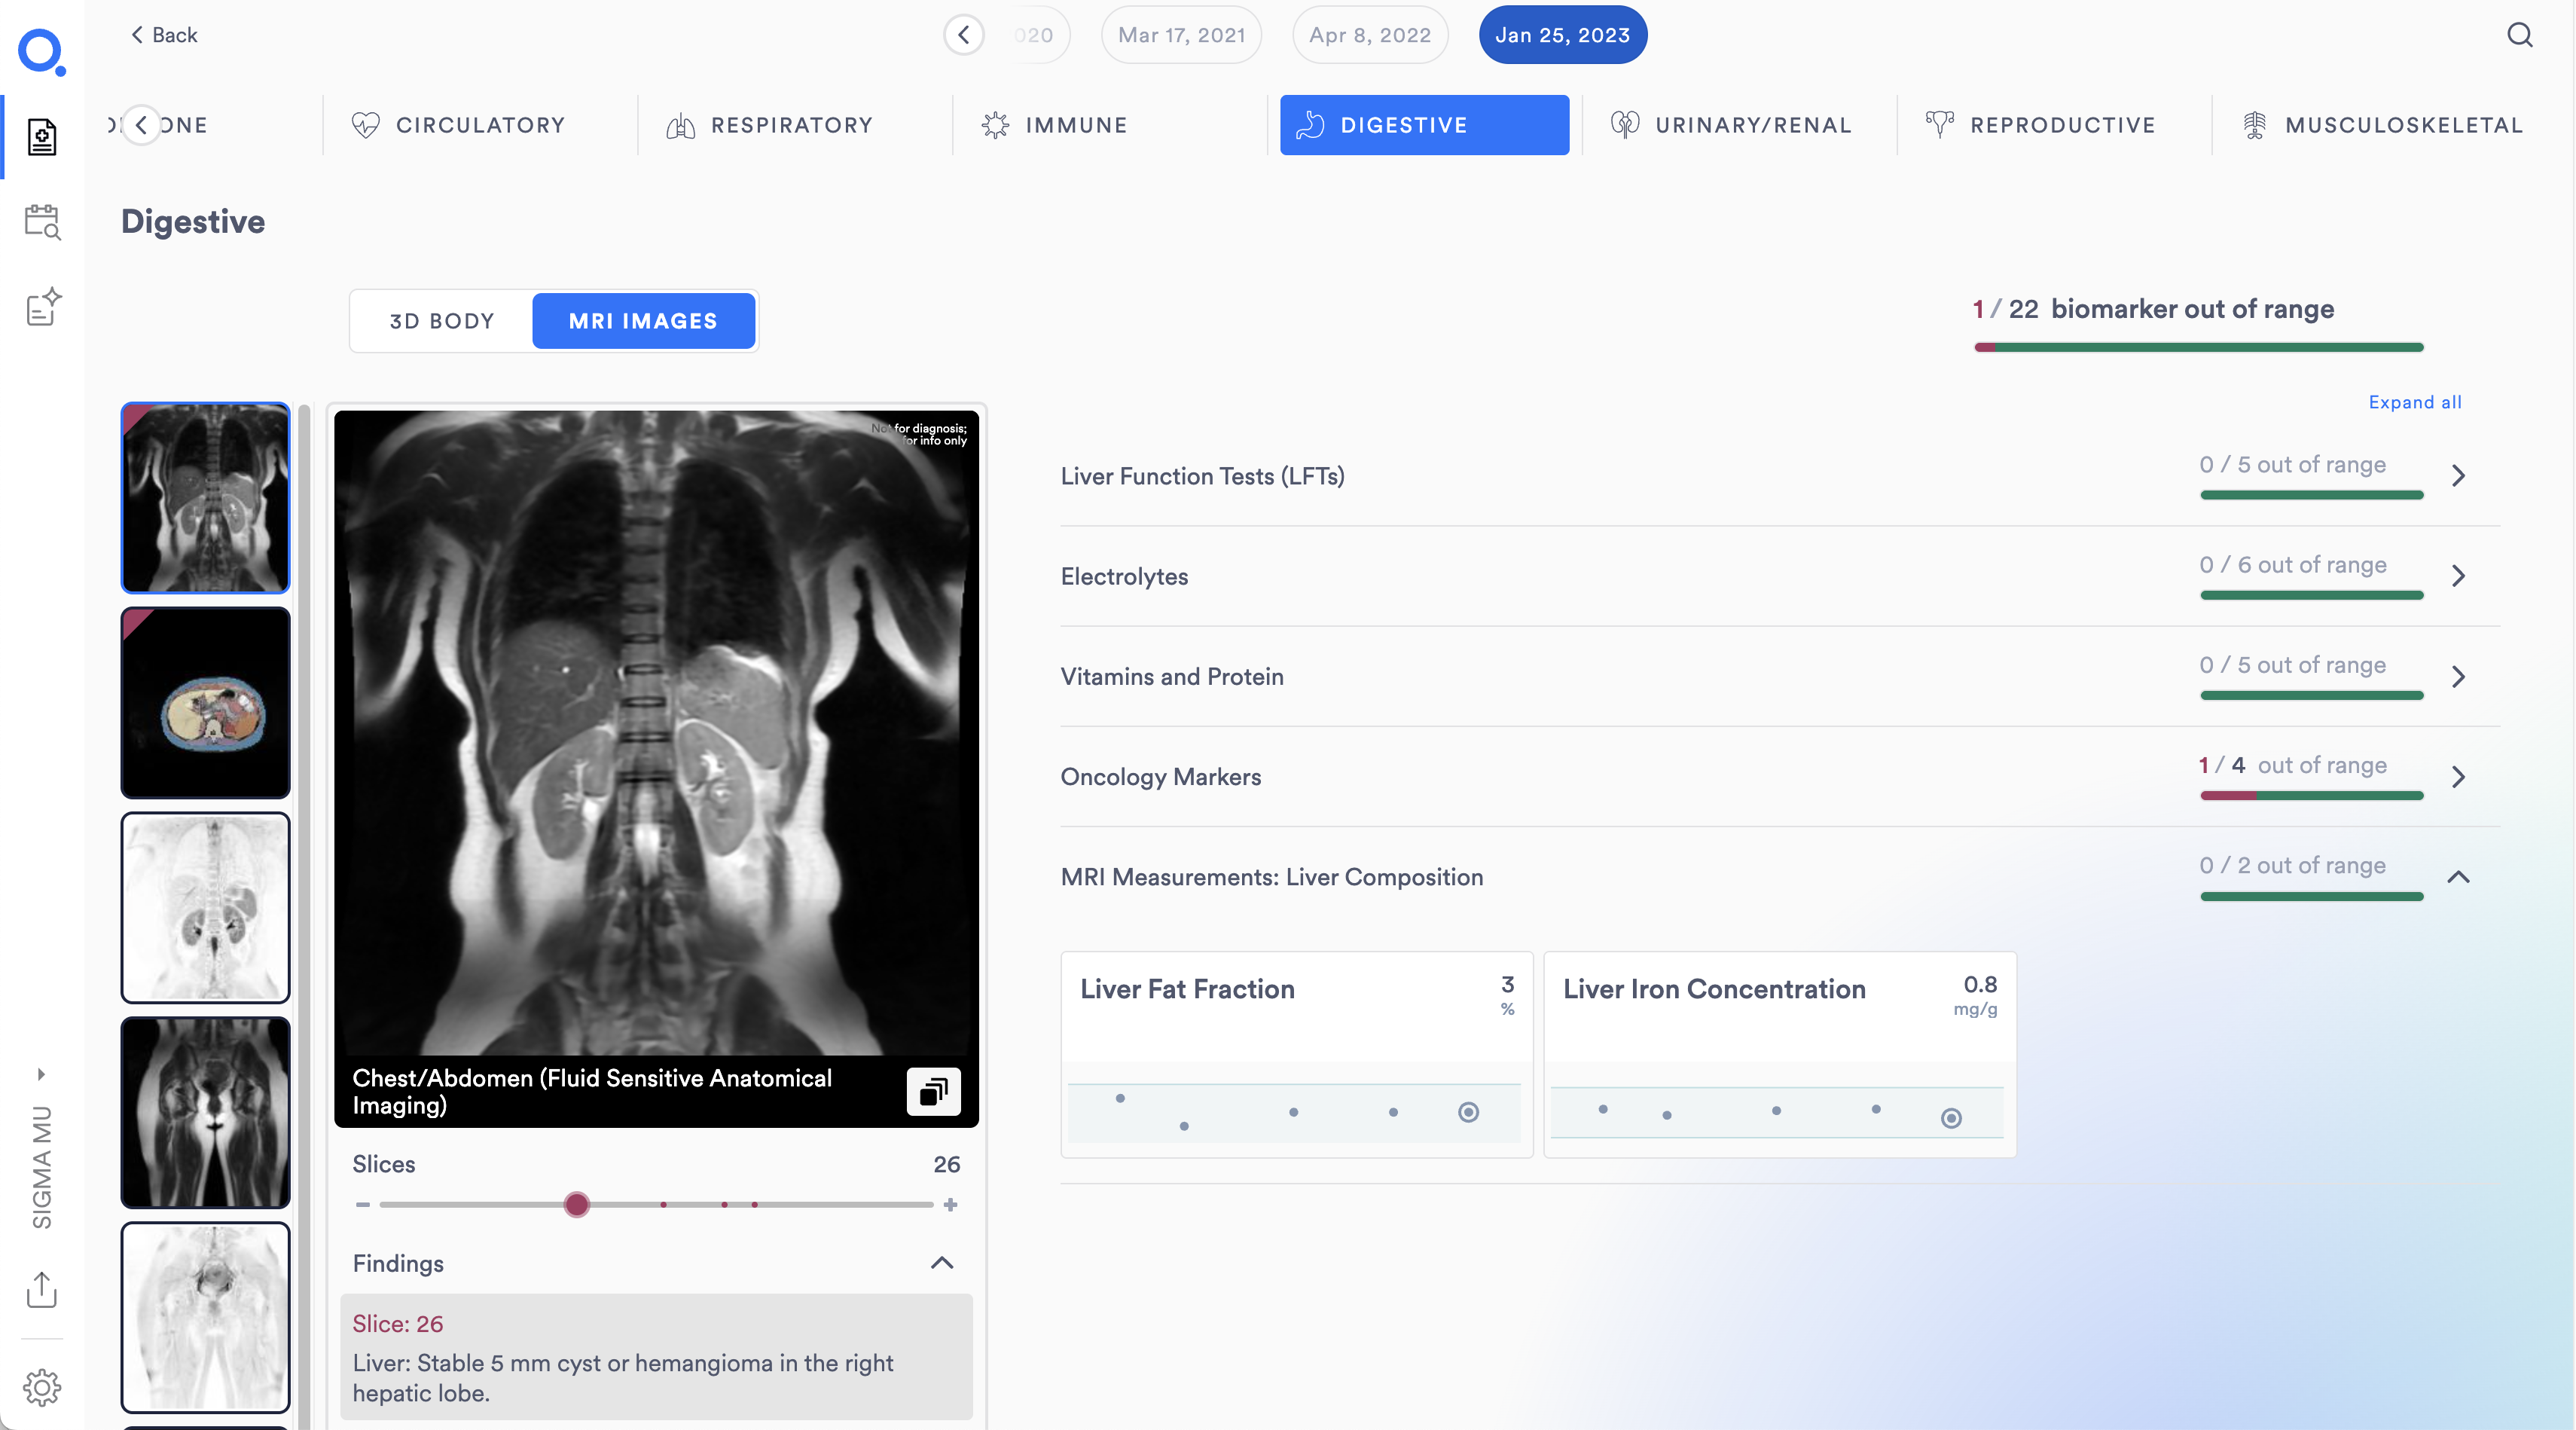
Clinical view · Digestive Digestive system detail in the Q Bio Health Dashboard: MRI viewer with chest and abdomen slice on the left, and biomarker panels on the right including Liver Function Tests, Electrolytes, Vitamins and Protein, Oncology Markers, and MRI Measurements: Liver Composition.
Digestive drill-down

Liver imaging alongside liver biomarkers

The same view applied to the digestive system — abdominal MRI on the left, Liver Function Tests, Electrolytes, Oncology Markers, and Liver Composition measurements on the right.

01 · Longitudinal value

Every exam is a comparison.

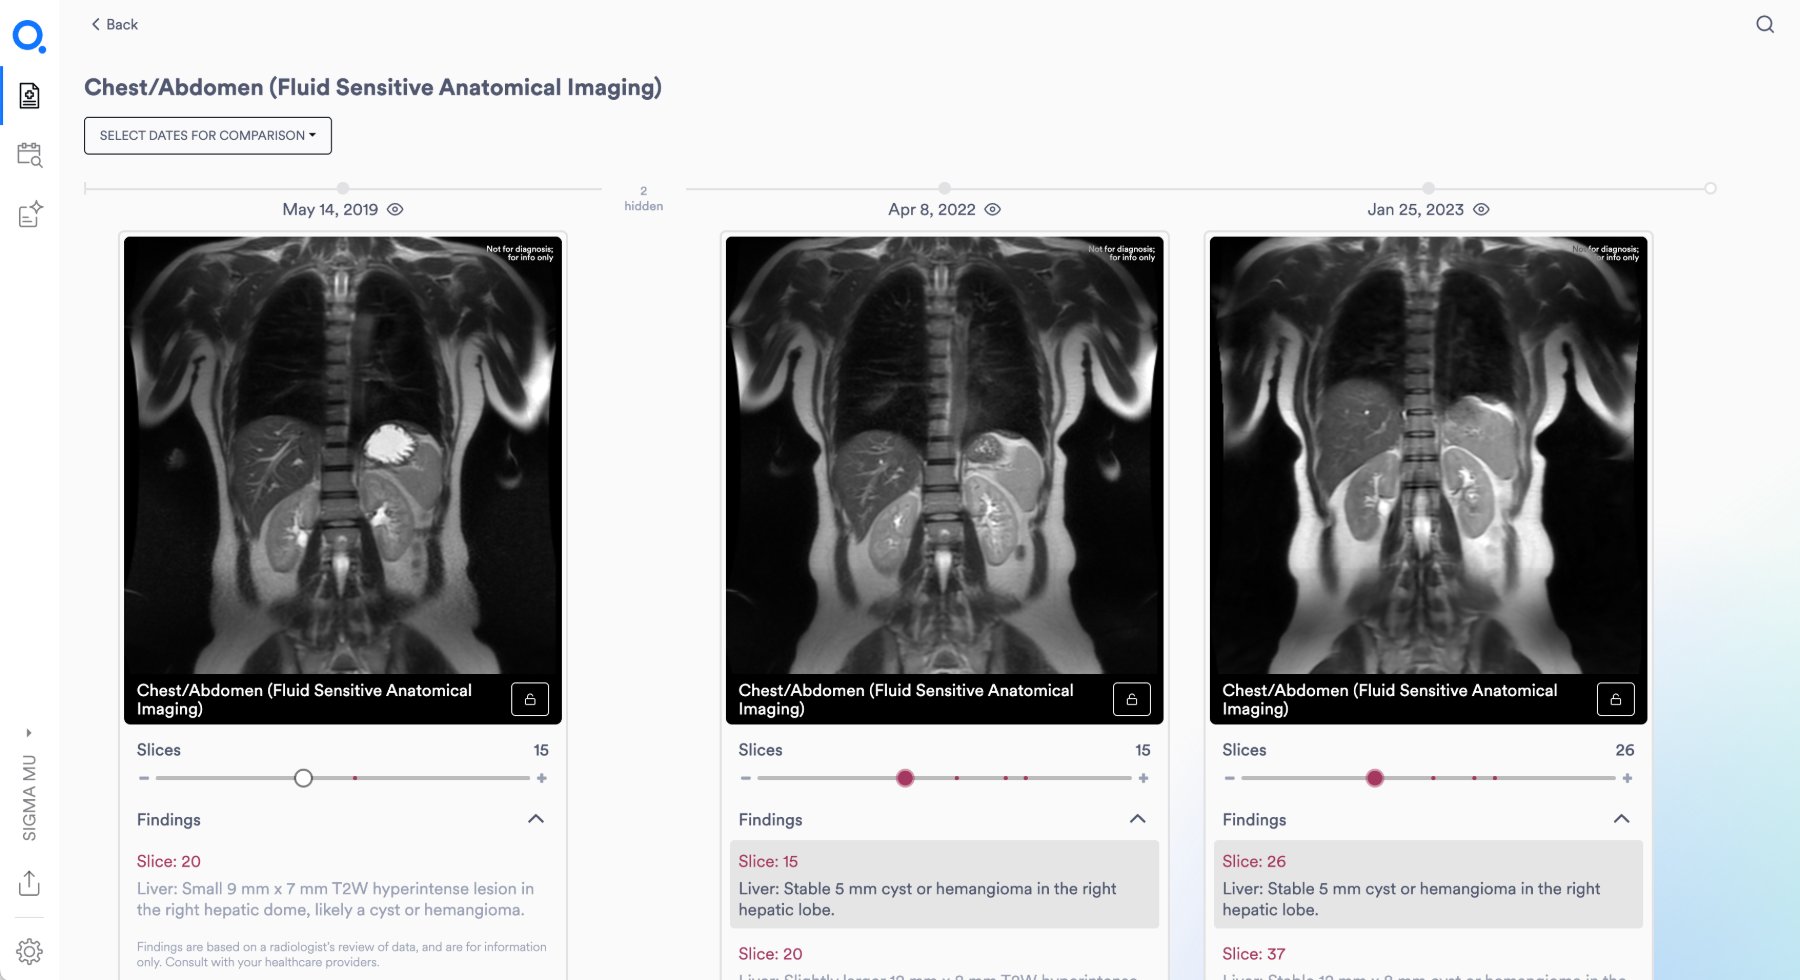
From the second visit onward, the dashboard puts each finding alongside its history — same patient, same protocol, same view, year over year. Because Constellation segments the same organs and tissues at every visit, year-over-year changes — in liver fat fraction, brain volume, or tissue composition — are real comparisons, not approximations.

Longitudinal · 2019 → 2023 Three side-by-side chest and abdomen MRI images dated May 2019, April 2022, and January 2023, each with slice controls and radiologist findings listed beneath.
01 · Same protocol

Apples to apples

Standardized acquisition means every visit can be compared directly to the last.

02 · Findings tracked

Stable, new, changed

Each finding is marked against its prior measurement — stable, new, or for review.

03 · Physician narrative

Radiologist context

Findings are read by a board-certified radiologist and written into the longitudinal record.

02 · Biomarker deep-dive

Every measurement, in context.

Because the Q Exam uses standardized acquisition and analysis, the dashboard is designed to make year-over-year changes — in areas like liver fat fraction, brain volume, or tissue composition — more visible and comparable over time.

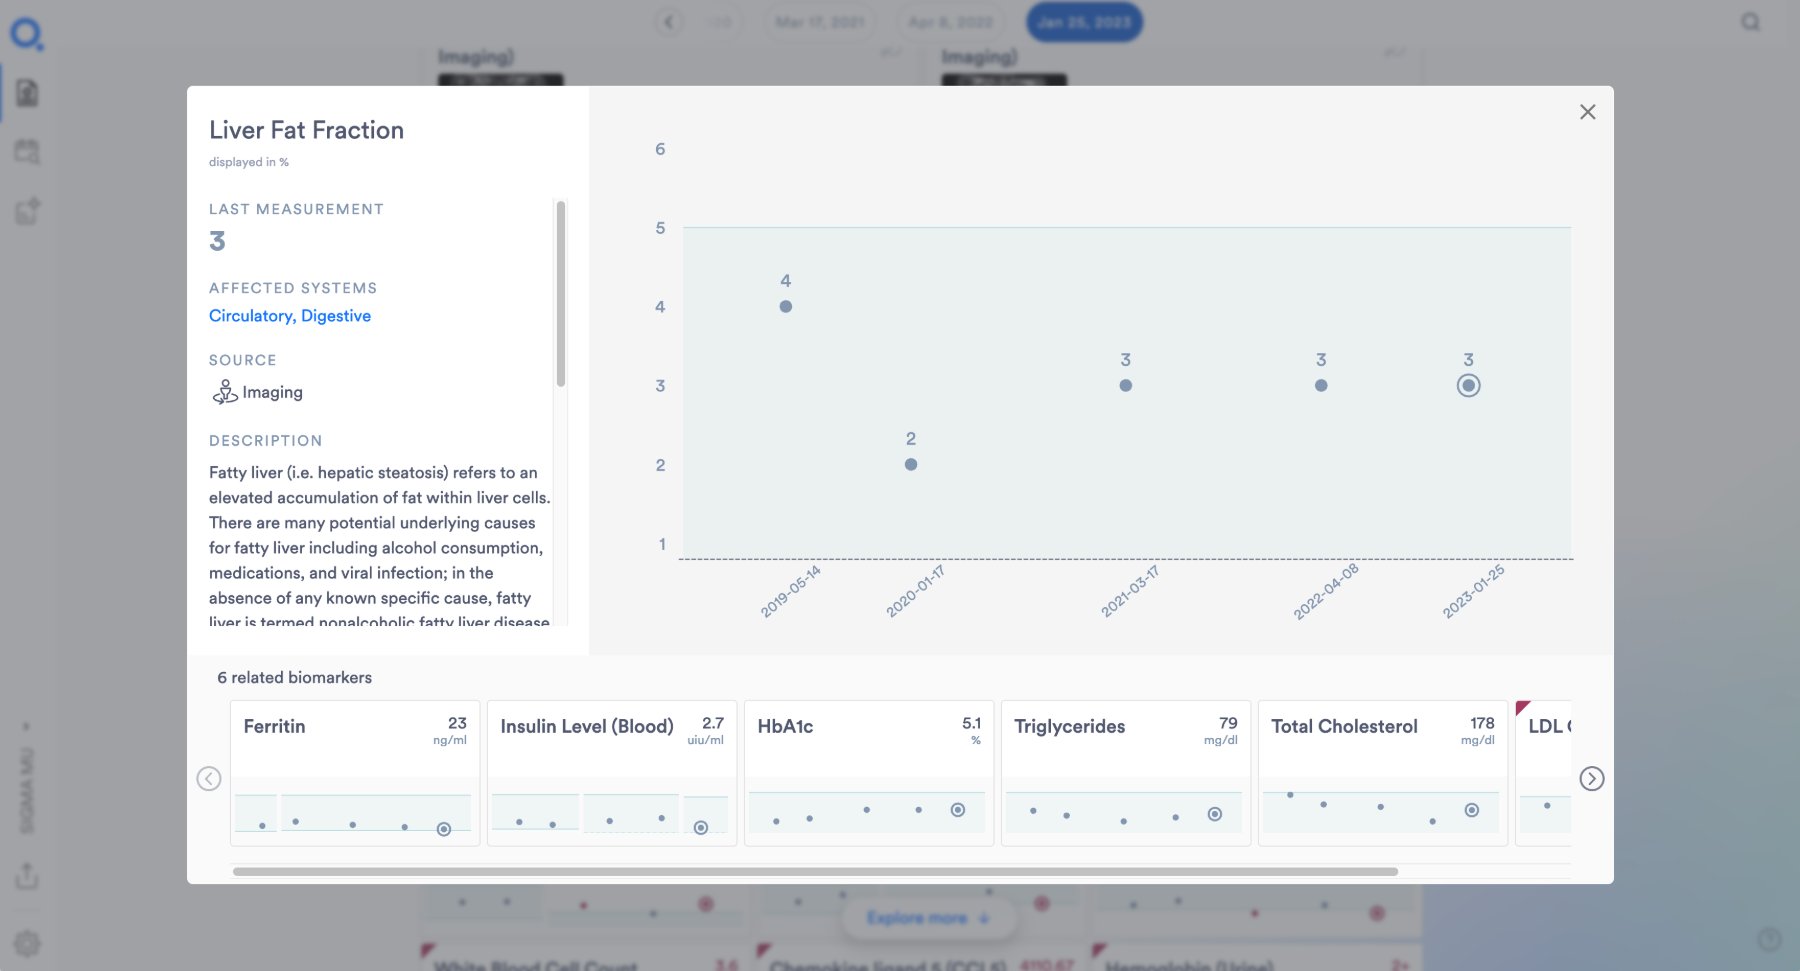
Biomarker · Liver Fat Fraction Liver Fat Fraction biomarker modal showing description, source, affected systems, a five-year trend chart, and a strip of related biomarkers including Ferritin, Insulin Level, HbA1c, Triglycerides, and Total Cholesterol.
01 · Definition

What it is, in plain language

Every biomarker carries a description, source, units, and the systems it affects.

02 · Trend

Years of history at a glance

Each measurement is plotted against its expected range, across every prior exam.

03 · Related markers

Read together, not alone

The biomarkers that move with it are surfaced inline, so context follows the click.

03 · Why it matters

Built to compound — for the patient and the partner.

The Dashboard's value grows in two directions: as a longitudinal record for the individual, and as a differentiated product surface inside a partner's premium care program.

Longitudinal value

One record. Compounding over time.

From the second exam onward, every finding can be compared to its prior measurements. The Dashboard turns a one-time exam into a longitudinal clinical relationship.

  • Standardized baseline at the first exam
  • Side-by-side comparison of imaging across visits
  • Biomarker trends with expected-range context
  • Findings marked stable, new, or for review
  • Physician interpretation written into the record
Partner value

A premium product your members return to.

For partners, the Dashboard is the user-facing product layer of the Q Exam — a longitudinal experience that anchors member engagement between visits.

  • Premium digital experience under your brand
  • Differentiated offering — deployed, not built from scratch
  • Repeat engagement across the calendar year
  • A clear longitudinal anchor for member retention
  • Clinical workflow surface for your care team